|
PASSENGERS TRANSPORTED
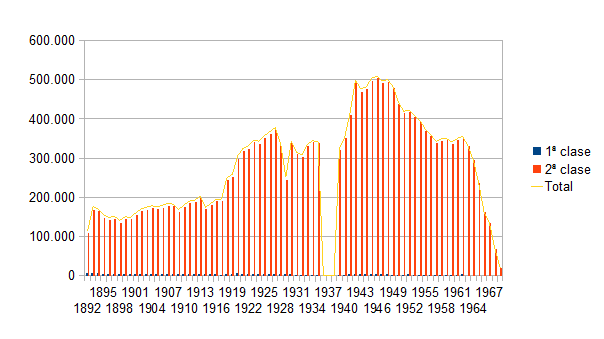
Taking into account that during the Civil War there was no passenger transport, the peak in the volume of passengers can be seen in the 1940s, from then onwards transport declined considerably. It stabilised again at the end of the 1950s and the beginning of the 1960s, but from then onwards the decline of the railways meant that the loss was dramatic year after year.
|
Year
|
1st class
|
2nd class
|
Total
|
Year
|
1st class
|
2nd class
|
Total
|
Year
|
1st class
|
2nd class
|
Total
|
|---|
|
1892
|
6.176
|
107.956
|
114.132
|
1918
|
3.673
|
244.217
|
249.808
|
1944
|
3.680
|
476.679
|
482.303
|
|
1893
|
7.766
|
168.099
|
175.865
|
1919
|
4.249
|
252.149
|
258.317
|
1945
|
5.181
|
496.566
|
503.692
|
|
1894
|
5.661
|
163.664
|
169.325
|
1920
|
5.326
|
298.860
|
306.106
|
1946
|
4.084
|
504.221
|
510.251
|
|
1895
|
4.578
|
147.930
|
154.403
|
1921
|
5.087
|
317.797
|
324.805
|
1947
|
3.622
|
491.756
|
497.325
|
|
1896
|
3.876
|
142.342
|
148.114
|
1922
|
4.876
|
324.167
|
330.965
|
1948
|
3.047
|
495.569
|
500.564
|
|
1897
|
4.069
|
145.469
|
151.435
|
1923
|
4.837
|
339.934
|
346.694
|
1949
|
2.315
|
478.701
|
482.965
|
|
1898
|
4.255
|
134.819
|
140.972
|
1924
|
4.404
|
336.404
|
342.732
|
1950
|
2.488
|
439.137
|
443.575
|
|
1899
|
4.246
|
143.725
|
149.870
|
1925
|
4.473
|
351.400
|
357.798
|
1951
|
2.171
|
415.003
|
419.125
|
|
1900
|
3.469
|
143.287
|
148.656
|
1926
|
4.956
|
360.421
|
367.303
|
1952
|
2.788
|
418.563
|
423.303
|
|
1901
|
4.048
|
154.537
|
160.486
|
1927
|
5.009
|
371.115
|
378.051
|
1953
|
2.597
|
405.012
|
409..562
|
|
1902
|
4.599
|
164.252
|
170.753
|
1928
|
4.079
|
331.878
|
337.885
|
1954
|
2.561
|
391.206
|
395.721
|
|
1903
|
4.999
|
167.585
|
174.487
|
1929
|
3.805
|
245.259
|
250.993
|
1955
|
2.658
|
370.127
|
374.740
|
|
1904
|
4.700
|
171.724
|
178.328
|
1930
|
3.139
|
337.903
|
342.972
|
1956
|
2.260
|
355.949
|
360.165
|
|
1905
|
4.376
|
169.191
|
175.472
|
1931
|
2.658
|
310.111
|
314.700
|
1957
|
1.658
|
339.218
|
342.833
|
|
1906
|
4.498
|
173.430
|
179.834
|
1932
|
2.203
|
303.608.
|
307.743
|
1958
|
2.099
|
344.762
|
348.819
|
|
1907
|
3.869
|
178.183
|
183.959
|
1933
|
1.568
|
331.919
|
335.420
|
1959
|
2.233
|
346.147
|
350.339
|
|
1908
|
3.739
|
176.424
|
182.071
|
1934
|
1.494
|
340.717
|
344.145
|
1960
|
2.101
|
337.060
|
341.121
|
|
1909
|
3.676
|
162.923
|
168.508
|
1935
|
1.391
|
338.085
|
341.411
|
1961
|
2.584
|
345.457
|
350.339
|
|
1910
|
3.755
|
175.256
|
180.921
|
1936
|
--
|
--
|
--
|
1962
|
3.062
|
351.064
|
356.088
|
|
1911
|
3.704
|
184.366
|
189.981
|
1937
|
--
|
--
|
--
|
1963
|
--
|
329.835
|
329.835
|
|
1912
|
3.986
|
186.526
|
192.424
|
1938
|
--
|
--
|
--
|
1964
|
--
|
294.351
|
294.351
|
|
1913
|
4.312
|
197.590
|
203.815
|
1939
|
755
|
321.469
|
324.163
|
1965
|
--
|
235.609
|
235.609
|
|
1914
|
2.967
|
168.864
|
173.745
|
1940
|
1.836
|
350.469
|
354.245
|
1966
|
--
|
161.159
|
161.159
|
|
1915
|
2.780
|
180.133
|
184.828
|
1941
|
3.141
|
410.961
|
416.043
|
1967
|
--
|
133.909
|
133.909
|
|
1916
|
2.852
|
190.075
|
194.843
|
1942
|
4.517
|
492.820
|
499.279
|
1968
|
--
|
68.508
|
68.508
|
|
1917
|
2.447
|
191.455
|
195.819
|
1943
|
4.653
|
470.012
|
476.608
|
1969
|
--
|
20.110
|
20.110
|
CHART

GOODS TRANSPORTED
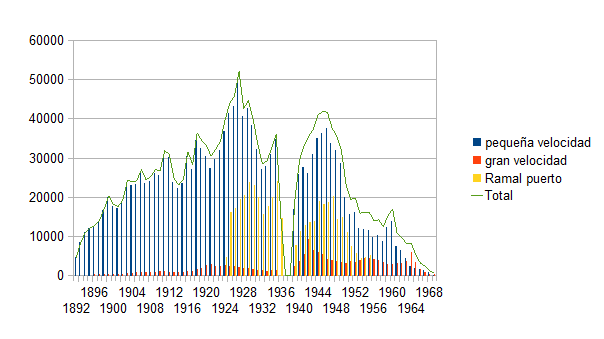
Freight transport was divided into low speed (blue) and high speed (red). The small speed were the trains in which freight transport prevailed, the high speed was often produced with one or several freight wagons added to the composition of a passenger train, which is why the numbers are so different.
|
Year
|
l. speed
|
h.speed
|
Total
|
Year
|
l. speed.
|
h.speed
|
Total
|
Year
|
l. speed
|
h.speed
|
Total
|
|---|
|
1892
|
4.677
|
--
|
4.677
|
1918
|
34.732
|
1.643
|
36.375
|
1944
|
35.000
|
6.019
|
41.049
|
|
1893
|
8.552
|
--
|
8.552
|
1919
|
32.639
|
1.872
|
34.511
|
1945
|
36.378
|
5.567
|
41.945
|
|
1894
|
11.128
|
--
|
11.128
|
1920
|
30.468
|
2.643
|
33.111
|
1946
|
37.555
|
4.139
|
41.694
|
|
1895
|
12.172
|
--
|
12.172
|
1921
|
27.551
|
2.911
|
30.462
|
1947
|
33.806
|
3.845
|
37.651
|
|
1896
|
12.382
|
491
|
12.873
|
1922
|
29.793
|
2.531
|
32.324
|
1948
|
31.946
|
3.729
|
35.672
|
|
1897
|
13.662
|
434
|
14.096
|
1923
|
31.966
|
2.404
|
34.370
|
1949
|
28.656
|
3.380
|
32.036
|
|
1898
|
16.653
|
382
|
17.035
|
1924
|
37.008
|
2.788
|
39.796
|
1950
|
20.161
|
3.090
|
23.251
|
|
1899
|
20.004
|
379
|
20.383
|
1925
|
41.617
|
2.388
|
44.005
|
1951
|
15.813
|
3.629
|
19.442
|
|
1900
|
17.773
|
376
|
18.149
|
1926
|
43.289
|
2.489
|
45.778
|
1952
|
16.235
|
3.568
|
19.803
|
|
1901
|
17.237
|
378
|
17.615
|
1927
|
50.052
|
2.062
|
52.114
|
1953
|
12.050
|
3.847
|
15..897
|
|
1902
|
18.822
|
435
|
19.257
|
1928
|
40.827
|
1.852
|
42.679
|
1954
|
11.782
|
4.450
|
16.232
|
|
1903
|
23.661
|
708
|
24.369
|
1929
|
42.828
|
1.851
|
44.679
|
1955
|
11.636
|
4.487
|
16.123
|
|
1904
|
23.198
|
733
|
23.931
|
1930
|
38.474
|
1.545
|
40.019
|
1956
|
9.744
|
4.253
|
13.997
|
|
1905
|
23.417
|
793
|
24.210
|
1931
|
32.303
|
1.424
|
33.727
|
1957
|
10.269
|
3.958
|
14.227
|
|
1906
|
26.242
|
863
|
27.105
|
1932
|
27.164
|
1.364
|
28.528
|
1958
|
8.904
|
3.518
|
12.422
|
|
1907
|
23.537
|
940
|
24.477
|
1933
|
28.072
|
1.271
|
29.343
|
1959
|
12.272
|
2.961
|
15.233
|
|
1908
|
24.239
|
975
|
25.214
|
1934
|
31.118
|
1.381
|
32.499
|
1960
|
13.932
|
3.043
|
16.975
|
|
1909
|
26.236
|
823
|
27.059
|
1935
|
34.768
|
1.427
|
36.195
|
1961
|
7.422
|
3.279
|
10.701
|
|
1910
|
25.680
|
1.074
|
26.754
|
1936
|
--
|
--
|
--
|
1962
|
6.444
|
3.207
|
9.652
|
|
1911
|
30.812
|
1.078
|
31.890
|
1937
|
--
|
--
|
--
|
1963
|
4.506
|
3.660
|
8.166
|
|
1912
|
30.174
|
854
|
31.028
|
1938
|
--
|
--
|
--
|
1964
|
2.369
|
5.922
|
8.291
|
|
1913
|
23.982
|
847
|
24.829
|
1939
|
16.860
|
2.545
|
19.405
|
1965
|
1.952
|
3.381
|
5.333
|
|
1914
|
22.315
|
823
|
23.138
|
1940
|
25.887
|
3.663
|
29.550
|
1966
|
1.567
|
1.615
|
3.182
|
|
1915
|
23.588
|
897
|
24.485
|
1941
|
27.835
|
5.406
|
33.241
|
1967
|
1.351
|
1.005
|
2.356
|
|
1916
|
30.609
|
1.063
|
31.672
|
1942
|
26.259
|
9.351
|
35.610
|
1968
|
982
|
281
|
1.263
|
|
1917
|
27.106
|
1.211
|
28.317
|
1943
|
31.068
|
6.415
|
37.483
|
1969
|
241
|
274
|
515
|
GRAPH OF FREIGHT TRANSPORT AS A WHOLE

PORT LINE TRAFFIC
|
Year
|
Tonnes
|
|
Year
|
Tonnes
|
|
Year
|
Tonnes
|
|---|
|
1924*
|
4.843
|
1935
|
24.262
|
1946
|
18.874
|
|
1925
|
16.148
|
1936*
|
14.619
|
1947
|
20.373
|
|
1926
|
17.348
|
1937
|
0
|
1948
|
14.406
|
|
1927
|
19.515
|
1938
|
0
|
1949
|
14.990
|
|
1928
|
20.520
|
1939*
|
7.799
|
1950
|
11.013
|
|
1929
|
23.974
|
1940
|
11.476
|
1951
|
7.623
|
|
1930
|
23.051
|
1941
|
12.975
|
1952
|
5.774
|
|
1931
|
20.160
|
1942
|
13.656
|
1953
|
4.356
|
|
1932
|
15.780
|
1943
|
13.915
|
1954
|
4.818
|
|
1933
|
17.817
|
1944
|
19.115
|
1955
|
5.243
|
|
1934
|
20.160
|
1945
|
18.150
|
|
|
* Traffic in the second half of the year * Traffic as of the release of the line on 6 February
* Traffic up to 18 July |
FREIGHT TRANSPORT PERFORMANCE
Regardless of other factors such as material wear and tear, economic problems, lack of State aid, etc., it can be seen in the graph that in the beginning the transport of cork and other products to Gerona had a prolonged rise until 1912, from then onwards there were ups and downs until the entry of the port branch line in 1924. From then on, goods traffic increased due to the fact that new horizons were opening up in the transport of goods from the port to Gerona. At the beginning of the 1930s, freight transport decreased, with the war being an obligatory stop, but once the war was over, transport with wagons added to the passenger trains (high speed) became more important. From the 1950s onwards, the total decline in activity began and each year there was less freight transport, the decline was less prolonged than that of passenger transport, but it was inexorable.
|

